Nov 13, 2026
What keeps readers on a long technical article
Long articles on one site held readers for a median of 21.5 seconds. What reading research supports, what is habit, and what the site changed on Nov 13, 2026.
Question: You publish long, research-style articles, and most visitors leave within seconds. What keeps a reader on a long technical article, and what gets them to try the thing it is about?
Short answer: The first two screens decide it. Put the answer at the top in plain words, then say what it leaves open, so a reader who has the answer still has a reason to scroll. State findings in the headings, let figures carry the argument and hide nothing behind a tap. Send readers to the product with one plain linked sentence near the top and a written invitation at the end. Much of this rests on practice or single studies.
What that leaves open: Which of this is measured and which is habit: each section names the evidence it rests on, and no experiment has tested a paragraph like this one. And whether it works: this site rebuilt its doc pages on these findings on Nov 13, 2026 and has measured nothing since. Section 13 says how it will be judged.
This site's visit numbers in this doc were counted by lib-visits, the cookieless analytics that runs on csarko.sh: a 3 KB script and a small collector. See what it does.
In numbers:
- 21.5 seconds was the median time on a doc on this site (section 1).
- 74% of viewing time went to the first two screenfuls (section 2).
- 2.47% is the click rate of the official-site link at the top of a Wikipedia article; links in its body get 0.14% (section 7).
- 1.4 times the share who read, or four times the clicks, is the least four weeks can show (section 13).
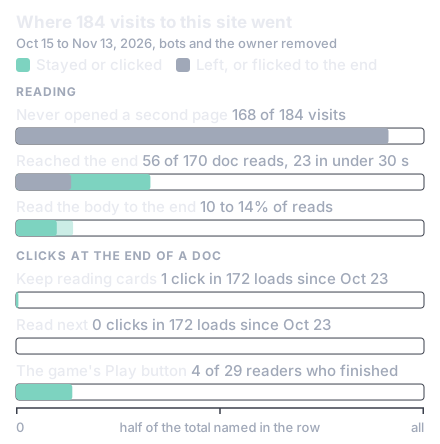
Between Oct 15 and Nov 13, 2026, this site had 184 visits by people, most of them to a research doc. That is the count after removing the site's owner and the bots, which made about 60% of all logged page loads. The median engaged time on a doc, meaning the seconds the page was visible in the tab, was 21.5 seconds.
A marker at the end of each doc records whether a reader got there. Of 170 doc reads, 56 reached it, but 23 of those took under 30 seconds: a flick to the bottom, not a read. A stricter test asks whether any section of the body stayed mid-screen for five seconds. Of the 145 doc reads since that test began on Oct 23, 54 passed it (37%), 29 held two body sections or more (20%), and only 10 to 14% both read the body and reached the end.
Almost nobody went further: 168 of the 184 visits never opened a second page. Each doc ended with a boxed block titled Keep reading. It held cards for other docs and, on the 26 docs that name the site's browser game, a Play button; a Read next link and the same button followed the author box. In the 172 doc page loads since those blocks were added on Oct 23, the cards got 1 click and Read next none. The Play button was clicked by 4 of the 29 readers who finished a doc that carried it.
About half the visits came from Google and a quarter from links inside ChatGPT answers, half of those on phones. And length did not predict time spent: the rank correlation between a doc's length and the time it got, which measures whether longer docs got longer visits, was about 0.01. The doc that held readers best is a 2,500 word answer to one concrete question, with a median of 84 seconds over 18 visits.
Are these numbers bad, or simply what reading on the web looks like?
They are close to normal. In browser logs covering 205,873 pages, the chance of leaving fell the longer a visitor had stayed on 98.5% of them: people screen a page first and only then read it [1]. Jakob Nielsen of the Nielsen Norman Group (NN/g), a usability research firm, reads those logs this way: the first 10 seconds are critical, and the chance of leaving flattens after about 30 [2].
Short visits are ordinary. Chartbeat's data on 2 billion visits across the web had 55% of all page visits and one in three article visits under 15 seconds [3]. Wikipedia's median reading time is 25 seconds and its 75th percentile, the time a quarter of visits exceed, is 75.1 seconds [4]. A 21.5 second median is ordinary, which is not the same as healthy.
Attention is top-heavy. In an eye-tracking study of 120 people on desktop, 57% of viewing time went above the fold, the bottom edge of the first screen, and 74% to the first two screenfuls [5]. And readers preview: logs of three interactive articles, more than 50,000 sessions, showed many readers who "quickly scroll through article content before leaving the page or engaging in depth" [6].
Length buys little. On pages of 30 to 1,250 words, each extra 100 words added 4.4 seconds, so about 18% of the added text was read [7]; that is 25 users in 2005, on pages shorter than articles. Nor is a short visit a failure in itself: search-log work found no single dwell time that means a visitor was satisfied [8].
The shape is consistent across large logs. The transfer is weaker: the data is Chartbeat's publisher network, Wikipedia and desktop logs from 2005 to 2019, not long technical write-ups. If the first two screens decide the visit, what belongs on them?
Guidance agrees on the start: lead with the conclusion, which NN/g says "can encourage scrolling", without data [9]. Eye tracking adds that people read every word when they believe they are in the best place for what they need, for example because the title matches their exact question [10]. Plain words matter at the top. In an experiment with 650 members of the public, jargon lowered interest and felt understanding even with a definition one hover away [11]. The authors add that terms are fine for specialists.
The trouble is what an answer does to curiosity. In Loewenstein's review, curiosity is attention on a gap in one's own knowledge. A posed question or puzzle raises it most directly, and it declines once a person is confident they know the answer [12]. This is the curiosity gap, and a page that answers in its first paragraph may close the only gap its reader had. That last step is an inference from the theory, not a tested result.
Newsrooms have a habit for this: the nut graf, a paragraph near the top that tells the impatient reader where the piece is going. It need not give away the end, though a piece about a study has to state the finding by then [13]. Well-read explainers do it by showing the finished thing first (section 10).
So the opening this doc uses has guidance behind its first half, the answer, and theory plus habit behind its second, what the answer leaves open. No experiment was found on whether an answer-first opening costs or gains reading time. The nearest data: at Norway's public broadcaster, readers who opened a summary at the top stayed 49 seconds against 25, but they chose to open it [14]. An opening can only earn the next screen; the body has to earn the rest.
Two things about structure have experiments behind them. Headings that state the point produce what NN/g calls layer-cake scanning: the eyes move from heading to heading, which it rates the most effective way to scan a page [10]. In an eye-tracking experiment, topic headings improved the processing of topic sentences and the recall of topics [15]. And breaking a lesson into segments that the learner paces beat one continuous unit in 7 of 7 tests, with a median effect size, the gain in standard deviations, of 0.67 [16]. Those were short lab lessons, measured on learning and not on time.
One addition is measured as harmful: interesting but irrelevant material, called seductive details, lowered learning across 58 studies [17].
The rest is agreement among practitioners. Join steps with "but" and "therefore", never "and then", says Nicky Case [18]. Tell it as the problem, the sticking point, what people tried and what let someone see it, says Thomas Lin of Quanta [19]. Michael Nielsen calls the long form of this discovery fiction: a plausible path to the result through naive ideas and their fixes [20]. None of these comes with reading-time data.
One caution on seconds: a review reports narrative text read about twice as fast and recalled about twice as well, an old, second-hand figure [21]. A better article may be read faster, so time can fall while reading improves. Structure is words, and a fast scroller reads few of them. The pictures have to carry the argument too.
The best field data is a study of the reader logs of three well-made interactive articles [6]. Their median visits were 78 to 116 seconds on desktop and 20 to 41 seconds on phones. Readers used a widget when it was central to the story, 85% of them in one article. The median number of uses of an optional details button was zero. And in one of the three, 41% of desktop readers and 62% of phone readers who reached the end never opened the content behind a click.
Practitioners had reached the same place without numbers. Archie Tse of the New York Times: "If you make a tooltip or rollover, assume no one will ever see it" [22]. A review in Distill concedes that "there is limited empirical evaluation of the effectiveness of interactive articles" [23].
For static figures the learning research is firmer. Words placed next to the part of the figure they describe beat words placed away from it in 9 of 9 tests, with a median effect size of 0.82 [16]. In one of them the far placement was a caption at the bottom of the screen. Removing extraneous material helped in 18 of 19 (0.86), and visual signals such as arrows, used sparingly, helped in 11 of 12 (0.71) [16].
That is measured on learning, in labs, never on time on a page. What it supports is modest: put the argument in the figures and their labels, where a fast scroller will see it, and hide nothing the argument needs. That leaves the reader who did finish, and where they go next.
Across Chartbeat's network of news sites, 89% of readers leave after one article; new visitors go on to a second one 9.1% of the time, phone readers 9% and desktop readers 19% [24]. On Wikipedia, 68 to 78% of sessions are a single page load [25]. This site's 168 of 184 is the norm for new visitors and for phones, and low only against the desktop figure.
Link modules do little. In a randomized study of 1.8 million first visits to seven news sites, 1.42% of first-time visitors clicked any link module, a block of related or popular links. A module at the end of the article beat one in the middle by 55%, and links with an image got 63% more clicks than links of text alone [26]. Those are relative lifts on a very low base. A related-pages module at the bottom of mobile Wikipedia had a click rate of 1.91%, or 6.0% when scrolled into view, and did not raise total page views [27]. At this sample, one click in 172 page loads cannot be told apart from the 1.42% norm.
The guidance is about form. Nothing should sit between the last paragraph and the next links, since gaps and rules read as the end of the page [28], [29]. Link text should say what the reader gets, not "Read more" [30]. A link that opens a new tab costs a phone reader the Back button [31]. Amit Patel's A* tutorial on Red Blob Games has no read-next block: it ends on a "More" section made of the reader's next questions [32].
So better next links are worth a few points, not a reversal. The link that matters more to an author is the one to the thing the article is about.
Every number in this section is one site or one company. On Wikipedia, the official-site link in the fact box at the top of an article is clicked at 2.47%, against 0.9% for fact-box links overall, 0.14% for links in the body and 0.03% for references [33]. It is highest where the subject's own site is the obvious place to go, so the link's meaning seems to count for more than its position.
HubSpot found that a linked line of text between a post's first paragraphs produced 47 to 93% of that post's leads, meaning forms filled in for a download, and the banner at its end 6% [34]. Those were 11 posts chosen for high lead counts, and the line was styled as a small heading. One non-profit's test gave an offer at the end of an article twice the clicks of the same offer in the middle, 4.4% against 2.2%, with no change in completed conversions [35].
Form matters as much as place. Content that looks like a promotion, or sits where promotions usually sit, tends to be ignored, a finding NN/g has replicated since 1997 [36]. Practice agrees. The four browser-game write-ups we looked at link the playable thing in the opening paragraph, as Max Bittker does: "If you're reading this but haven't played sandspiel, you should probably go try it!" [37]. Josh Comeau's pitch for his course is a written section near the end of a tutorial that names the reader's effort and offers more of the same [38].
No write-up was found that reports a click rate from a technical article to a game, an app or a film. So the direction is all there is: a plain, specific link early, a written invitation at the true end, nothing boxed in the middle. This site's 4 of 29 agrees with the end placement and says nothing about the early link, which did not exist. Who arrives, and from where, changes what the first screen has to do.
About three quarters of this site's visits came from Google or from a link inside a ChatGPT answer, and the published evidence on such readers is thin. When a Google results page carried an AI summary, users clicked a result on 8% of visits against 15% without one, and clicked a link inside the summary on 1% [39]. That is an observational study of 900 adults. Two newsrooms disagree outright: one saw ChatGPT readers stay 22 seconds, under half the time of its search readers, and the other saw them level [40].
Some of these readers never see the opening. In one author's unreviewed analysis from March 2026, 70.9% of Google AI Mode's citation links and 51.8% of Gemini's carried a text fragment [41]. A text fragment is a part of the address that scrolls the browser to one sentence and highlights it [42]. ChatGPT's links went to the top of the page. So headings have to orient a reader who lands in the middle.
No peer-reviewed work was found on what these readers do on the page they reach. The safe reading: they hold a summary already and arrive to check it or go deeper. The first screen has to confirm what the link promised [43] and then offer what the summary could not: the measurement, the figure, the running thing. On this site, half of the ChatGPT arrivals saw it on a phone.
Phones do not rule out long articles. In 117 million phone sessions on news sites, long articles got about twice the engaged time of short ones, 123 seconds against 57 on average [44]. Comprehension on a phone matched a computer in a study of 276 people, though hard passages took about 30 milliseconds more per word [45]. But the same article gets less time: phone medians on the three interactive articles of section 5 were 23 to 52% of the desktop ones [6]. And folding content away costs the readers who would have read it. On mobile Wikipedia, showing sections open instead of collapsed raised reading time at the 75th percentile from 38 to 53 seconds, while the median barely moved [46].
Nothing was found that measures phone layout for technical write-ups. Our inference from those medians is that a phone reader's whole visit is often about two screens, so those two screens are the article for most phone readers. Measurement runs out here. What is left is what well-read writers do.
All of this is practice, not measurement, and these writers have followings: many of their readers probably arrive already willing to read, which a cold arrival from search is not. Look down the first column: each device puts something in front of the reader instead of asking for a tap or for patience.
| Device | Who uses it | What it does |
|---|---|---|
| The finished thing first, then a promise to explain it | Bartosz Ciechanowski [47], Comeau [38] | Makes the picture a question |
| A simpler version of the problem first | Patel [48] | Shows the page is for them |
| A case before the idea | Julia Evans [49], Case [18] | Gives each term a case to hang on |
| "But" and "therefore", failures kept in | Case [18], Lin [19], M. Nielsen [20] | Each section hands on a problem |
| Every variant shown, no forced taps | Patel [50], Bret Victor [51] | Non-tappers see every state |
| The next step as the reader's question | Patel [32] | The link meets the need |
| The product linked in paragraph one | Bittker [37] | No pitch is needed |
| One quiet line on who made it | Fly.io [52] | Tells without interrupting |
They disagree with each other on length and on interaction, and Dan Luu's caution covers the whole table: "Copying what's worked for someone else is unlikely to work for you" [53]. The evidence is firmer about what to leave out.
Each is a common suggestion with evidence against it, or none for it.
- Withholding or teasing the answer. Plain headlines did as well as clickbait [54].
- Pop-ups and autoplay. Modals, content that shifts and autoplay were the most disliked formats in a survey of 452 adults; related links and static ads in the side rail were the least [55].
- Hiding what the argument needs, or adding widgets to raise time. In one studied article about half of finishers never opened hidden content, and optional controls had a median of zero uses [6].
- Taking over the scroll. Scrolljacking, a page that moves at its own pace when the reader scrolls, harmed control and task success in usability tests [56].
- Tuning fonts and column widths. On one long-form site, years of A/B tests, which show two versions to random halves of the visitors, mostly found nothing. An early win of 10 to 20% shrank to 0.4% [57].
- Counting scroll-to-end or shares as reading. Of this site's 56 end-marker hits, 23 took under 30 seconds, and 75% of link shares on Facebook were made without opening the link [58].
- Trusting a small test. In one published example, groups of 82 and 75 visitors produced a 337% "lift"; wins from tests that small are mostly false or exaggerated [59].
The last item bites a small site hardest, because it is also the rule for judging any change to the page.
Raw time on page is a poor target. The median is set by the screeners, a faster read can be a better one (section 4), and no single dwell time means a reader was satisfied (section 2). These measures say more; the first is the one a fast scroll cannot fake.
| Measure | Definition | Why it is better |
|---|---|---|
| Reader rate | Share of visits in which a section of the body stayed mid-screen for 5 seconds | A flick never triggers it. On this site: 37% (54 of 145 reads, Oct 24 to Nov 13) |
| Past 30 seconds | Share of visits with more than 30 seconds of engaged time | Leaving flattens there, and the median hides movement on either side |
| Product clicks per reader | Clicks on each product link, named by its position on the page | A screener was never going to click, so per reader is the fair rate |
| Follow-through | Visits in which the click is followed by use of the product | A click is not use |
Split each by referrer and by phone and desktop: phone time is not comparable with desktop time (section 9).
Check the clock before trusting it. When nine visits in ten are one page, every timing rests on the page's own last report. Analytics that time a page by the next page view record no time for the last page of a visit [60], and a page that reports only when it unloads loses phone visits. The page has to send its engaged time when the tab is hidden. And remove the bots first.
What did one site build from all this, and how would it know it worked?
This section describes csarko.sh as of Nov 13, 2026, the day the changes shipped.
The baseline in section 1 pointed at the first screens, so we measured nine docs on a phone screen 390 px wide and 700 px tall. The Question started 522 to 658 px down the page and the Short answer 741 to 973 px down, so none of the nine showed any of the answer on the first screen. Three lines of series navigation took 53 to 129 px above them. Nothing said what the body added, and none of the 49 docs linked its app or its film.
Five things changed, all on the same day:
- The answer moved up. The series navigation became one line of 22 px. The Question starts at 394 to 459 px and the Short answer at 589 to 765 px, so its first line is on the first screen on 8 of the 9 measured docs.
- A "What that leaves open" paragraph follows the Short answer on the 12 most visited docs. It is the change with the least evidence behind it (section 3).
- One plain product line follows the opening on 44 of the 49 docs: a sentence saying what the project is, with one link, and no box or button.
- A written "What next" section replaced the boxed Keep reading block: a closing paragraph with the product link, then up to three next docs, each worded as the question it answers.
- Links to the site's own hosts open in the same tab, so Back returns to the article, and each position of the product link sends its own named click event.
Here is one opening before and after, abridged, from the site's most visited doc, which asks whether a 45 second horror short found on Reddit was generated. Look at the third box: that paragraph did not exist before.
Before, as of Oct 23, 2026: Short answer: yes, it was generated. It is episode 18 part 5 of "Архив Аномалии" (Archive of Anomaly), a Russian AI anthology by the two person studio XCVmind, made as five image-to-video clips from one shared character reference and finished in a video editor. The exact model cannot be read from the file, because Reddit's transcode strips every provenance tag. [...]
After, Nov 13, 2026: Short answer: Yes, it was generated. It is five clips, each a still picture animated by a video model (image-to-video), all from one reference image of the woman, then slowed and grained in an editor. It comes from "Архив Аномалии" (Archive of Anomaly), a Russian AI anthology by the two person studio XCVmind. Reddit's re-encode strips every tag, so the file cannot name the model. [...]
After, the new paragraph: What that leaves open: how anyone can tell, when Reddit's copy carries no tags at all and the only evidence is the picture. Three things in the picture settle that it was generated: a white shape on the windowsill turns into a person, the candles change number and place inside one take, and a door's lock changes as the camera walks up to it.
The two terms that sat behind taps, image-to-video and Reddit's transcode, are said in plain words, and the reader who has the answer is handed a puzzle the body solves: how anyone can tell. Every fact was already in the doc.
None of this has been measured. It will be judged after four weeks, on two numbers: the share of readers who dwell on section 1 or later, and clicks on the product links. It will not be judged on the median, which cannot show a change at this size. At about 50 visits a week, four weeks give roughly 200 visits before and 200 after. The figures that follow are our own rough power estimates, for an 80% chance of detecting a change at the 5% significance level. The reader rate would have to rise from 37% to about 51%, roughly 1.4 times, and product clicks to roughly quadruple, from 4 to about 16, to be told from noise. Anything smaller is not failure; it is unmeasurable at this size.
Three things limit even a result that large. The click count is not like for like. The old button sat at the end of 26 docs and the new link sits in three places on 44, so some rise is expected from the extra links alone. All five changes shipped together, so no gain could be credited to one of them. And the comparison has no control group, so a shift in which docs people land on could fake a gain or hide one. A result worth reporting is one that repeats in the four weeks after.
What next
To check your own pages, open one on a phone and see where the first line of the answer falls, then count the visits that hold a section of the body for five seconds. This site's visit numbers came out of lib-visits, which counts csarko.sh with no cookies. Its page opens on one sample visit, drawn as lib-visits records every visit: where it came from, each page with its engaged time and scroll depth, and how it ended. The numbers that judge the Nov 13, 2026 change will come from it too. See what it does.
- How was a viral AI horror short made, and what does one like it cost?
- How does the Codex app embed its browser, and can a non-Electron app copy it?
- How can a site count visits, and the path each took, without cookies?
Part 2 of 2 in Writing for readersPrevious: Why a voice profile didn't get Claude past Substack's AI check
New research as it lands: the feed (RSS).
- [1]C. Liu, R. W. White, and S. Dumais, "Understanding web browsing behaviors through Weibull analysis of dwell time," in Proc. 33rd Int. ACM SIGIR Conf. Research and Development in Information Retrieval, 2010. Accessed: Nov. 13, 2026. [Online]. Available: https://www.microsoft.com/en-us/research/wp-content/uploads/2010/10/dwelltime.pdf
- [2]J. Nielsen, "How long do users stay on web pages?," Nielsen Norman Group, Sep. 11, 2011. Accessed: Nov. 13, 2026. [Online]. Available: https://www.nngroup.com/articles/how-long-do-users-stay-on-web-pages/
- [3]T. Haile, "What you think you know about the web is wrong," Time, Mar. 9, 2014. Accessed: Nov. 13, 2026. [Online]. Available: https://time.com/12933/what-you-think-you-know-about-the-web-is-wrong/
- [4]Wikimedia Foundation, "Reading/Web/Accessibility for reading/Repository/Readability research report," MediaWiki. Accessed: Nov. 13, 2026. [Online]. Available: https://www.mediawiki.org/wiki/Reading/Web/Accessibility_for_reading/Repository/Readability_research_report
- [5]T. Fessenden, "Scrolling and attention," Nielsen Norman Group, Apr. 15, 2018. Accessed: Nov. 13, 2026. [Online]. Available: https://www.nngroup.com/articles/scrolling-and-attention/
- [6]M. Conlen, A. Kale, and J. Heer, "Capture & analysis of active reading behaviors for interactive articles on the web," Comput. Graph. Forum, vol. 38, no. 3, 2019. Accessed: Nov. 13, 2026. [Online]. Available: https://idl.cs.washington.edu/files/2019-IdyllAnalytics-EuroVis.pdf
- [7]J. Nielsen, "How little do users read?," Nielsen Norman Group, May 5, 2008. Accessed: Nov. 13, 2026. [Online]. Available: https://www.nngroup.com/articles/how-little-do-users-read/
- [8]Y. Kim, A. Hassan, R. W. White, and I. Zitouni, "Modeling dwell time to predict click-level satisfaction," in Proc. 7th ACM Int. Conf. Web Search and Data Mining, 2014. Accessed: Nov. 13, 2026. [Online]. Available: https://www.microsoft.com/en-us/research/wp-content/uploads/2016/02/KimWSDM2014.pdf
- [9]A. Schade, "Inverted pyramid: Writing for comprehension," Nielsen Norman Group, Feb. 11, 2018. Accessed: Nov. 13, 2026. [Online]. Available: https://www.nngroup.com/articles/inverted-pyramid/
- [10]K. Pernice, "Text scanning patterns: Eyetracking evidence," Nielsen Norman Group, Aug. 25, 2019. Accessed: Nov. 13, 2026. [Online]. Available: https://www.nngroup.com/articles/text-scanning-patterns-eyetracking/
- [11]Ohio State University, "The use of jargon kills people's interest in science, politics," ScienceDaily, Feb. 12, 2020. Accessed: Nov. 13, 2026. [Online]. Available: https://www.sciencedaily.com/releases/2020/02/200212084357.htm
- [12]G. Loewenstein, "The psychology of curiosity: A review and reinterpretation," Psychol. Bull., vol. 116, no. 1, pp. 75-98, 1994. Accessed: Nov. 13, 2026. [Online]. Available: https://www.cmu.edu/dietrich/sds/docs/loewenstein/PsychofCuriosity.pdf
- [13]H. J. Morris, "Nut graf and lead duos that point readers in the right direction," NPR Training, Jun. 3, 2021. Accessed: Nov. 13, 2026. [Online]. Available: https://www.npr.org/sections/npr-training/2025/05/29/g-s1-64764/nut-graf-and-lead-duos-that-point-readers-in-the-right-direction
- [14]M. Adami, "How Norway's public broadcaster uses AI-generated summaries to reach younger audiences," Reuters Institute for the Study of Journalism, Jun. 4, 2024. Accessed: Nov. 13, 2026. [Online]. Available: https://reutersinstitute.politics.ox.ac.uk/news/how-norways-public-broadcaster-uses-ai-generated-summaries-reach-younger-audiences
- [15]J. Hyönä and R. F. Lorch, "Effects of topic headings on text processing: Evidence from adult readers' eye fixation patterns," Learn. Instr., vol. 14, no. 2, pp. 131-152, Apr. 2004. Accessed: Nov. 13, 2026. [Online]. Available: https://scholars.uky.edu/en/publications/effects-of-topic-headings-on-text-processing-evidence-from-adult-/
- [16]R. E. Mayer, "Research-based principles for designing multimedia instruction," in In Their Own Words: What Scholars and Teachers Want You to Know About Why and How to Apply the Science of Learning in Your Academic Setting, Division 2, American Psychological Association, 2023. Accessed: Nov. 13, 2026. [Online]. Available: https://www.unh.edu/teaching-learning-resource-hub/sites/default/files/media/2023-06/itow-research-based-principles-for-designing-multimedia-instruction-mayer.pdf
- [17]Washington State University, "Seductive details inhibit learning," ScienceDaily, Mar. 23, 2020. Accessed: Nov. 13, 2026. [Online]. Available: https://www.sciencedaily.com/releases/2020/03/200319103223.htm
- [18]N. Case, "How I make explorable explanations," blog.ncase.me, 2017. Accessed: Nov. 13, 2026. [Online]. Available: https://blog.ncase.me/how-i-make-an-explorable-explanation/
- [19]S. D'Agostino, "Quanta's Thomas Lin trusts public can handle complex ideas," Inside Higher Ed, Sep. 8, 2026. Accessed: Nov. 13, 2026. [Online]. Available: https://www.insidehighered.com/node/218366
- [20]M. Nielsen, "Discovery fiction," michaelnotebook.com, Jan. 3, 2023. Accessed: Nov. 13, 2026. [Online]. Available: https://michaelnotebook.com/df/index.html
- [21]M. F. Dahlstrom, "Using narratives and storytelling to communicate science with nonexpert audiences," Proc. Natl. Acad. Sci. USA, vol. 111, suppl. 4, pp. 13614-13620, Sep. 2014. Accessed: Nov. 13, 2026. [Online]. Available: https://pmc.ncbi.nlm.nih.gov/articles/PMC4183170/
- [22]A. Tse, "Why we are doing fewer interactives," presented at Malofiej Infographics World Summit, 2016. Accessed: Nov. 13, 2026. [Online]. Available: https://github.com/archietse/malofiej-2016/blob/master/tse-malofiej-2016-slides.pdf
- [23]F. Hohman, M. Conlen, J. Heer, and D. H. Chau, "Communicating with interactive articles," Distill, Sep. 2020. Accessed: Nov. 13, 2026. [Online]. Available: https://distill.pub/2020/communicating-with-interactive-articles/
- [24]J. Neary, "How recirculation varies by site category, device, and loyalty," Chartbeat Blog, Dec. 5, 2022. Accessed: Nov. 13, 2026. [Online]. Available: https://chartbeat.com/resources/research/recirculation-by-category-device-loyalty/
- [25]T. Piccardi, M. Gerlach, A. Arora, and R. West, "A large-scale characterization of how readers browse Wikipedia," arXiv:2112.11848, Dec. 2021. Accessed: Nov. 13, 2026. [Online]. Available: https://arxiv.org/abs/2112.11848
- [26]J. Collier and N. J. Stroud, "Using links to keep readers on news sites," Center for Media Engagement, Sep. 2018. Accessed: Nov. 13, 2026. [Online]. Available: https://mediaengagement.org/research/links/
- [27]Wikimedia Foundation, "Reading/Web/Projects/Related pages," MediaWiki. Accessed: Nov. 13, 2026. [Online]. Available: https://www.mediawiki.org/wiki/Reading/Web/Projects/Read_more
- [28]H. Loranger, "Related content boosts pageviews, when done right," Nielsen Norman Group, Oct. 5, 2014. Accessed: Nov. 13, 2026. [Online]. Available: https://www.nngroup.com/articles/related-content-pageviews/
- [29]K. Flaherty, "The illusion of completeness: What it is and how to avoid it," Nielsen Norman Group, Jan. 17, 2016. Accessed: Nov. 13, 2026. [Online]. Available: https://www.nngroup.com/articles/illusion-of-completeness/
- [30]M. McCloskey, "Writing hyperlinks: Salient, descriptive, start with keyword," Nielsen Norman Group, Mar. 9, 2014. Accessed: Nov. 13, 2026. [Online]. Available: https://www.nngroup.com/articles/writing-links/
- [31]J. Nielsen and A. Kaley, "Opening links in new browser windows and tabs," Nielsen Norman Group, Sep. 27, 2020. Accessed: Nov. 13, 2026. [Online]. Available: https://www.nngroup.com/articles/new-browser-windows-and-tabs/
- [32]A. Patel, "Introduction to the A* algorithm," Red Blob Games, 2014. Accessed: Nov. 13, 2026. [Online]. Available: https://www.redblobgames.com/pathfinding/a-star/introduction.html
- [33]T. Piccardi, M. Redi, G. Colavizza, and R. West, "On the value of Wikipedia as a gateway to the web," arXiv:2102.07385, Feb. 2021. Accessed: Nov. 13, 2026. [Online]. Available: https://arxiv.org/abs/2102.07385
- [34]P. Vaughan, "How the HubSpot marketing blog actually generates leads (hint: it's not how you think)," HubSpot Blog, Mar. 16, 2016. Accessed: Nov. 13, 2026. [Online]. Available: https://web.archive.org/web/20160602141151/http://blog.hubspot.com:80/marketing/blog-anchor-text-call-to-action-study
- [35]NextAfter, "How the placement of an offer on article pages impacts conversion," experiment 2452, Nov. 2017. Accessed: Nov. 13, 2026. [Online]. Available: https://www.nextafter.com/?p=14391
- [36]K. Pernice, "Banner blindness revisited: Users dodge ads on mobile and desktop," Nielsen Norman Group, Apr. 22, 2018. Accessed: Nov. 13, 2026. [Online]. Available: https://www.nngroup.com/articles/banner-blindness-old-and-new-findings/
- [37]M. Bittker, "Making Sandspiel," maxbittker.com, Apr. 30, 2019. Accessed: Nov. 13, 2026. [Online]. Available: https://maxbittker.com/making-sandspiel
- [38]J. W. Comeau, "An interactive guide to Flexbox in CSS," joshwcomeau.com, Nov. 22, 2022. Accessed: Nov. 13, 2026. [Online]. Available: https://www.joshwcomeau.com/css/interactive-guide-to-flexbox/
- [39]A. Chapekis and A. Lieb, "Google users are less likely to click on links when an AI summary appears in the results," Pew Research Center, Jul. 22, 2025. Accessed: Nov. 13, 2026. [Online]. Available: https://www.pewresearch.org/short-reads/2025/07/22/google-users-are-less-likely-to-click-on-links-when-an-ai-summary-appears-in-the-results/
- [40]A. Kaplan, "What metrics matter? Two case studies. And a survey," (Re)Structured News, Jan. 12, 2026. Accessed: Nov. 13, 2026. [Online]. Available: https://restructurednews.substack.com/p/what-metrics-matter-two-case-studies
- [41]D. Shashko, "How Google picks which sentences to cite in AI Mode: Reverse-engineering 42,971 citations," HackMD, Mar. 2026. Accessed: Nov. 13, 2026. [Online]. Available: https://hackmd.io/@A09fyOMpSD2VYIJodmXHqQ/r1eJyqthdbe
- [42]Mozilla, "Text fragments," MDN Web Docs. Accessed: Nov. 13, 2026. [Online]. Available: https://developer.mozilla.org/en-US/docs/Web/URI/Reference/Fragment/Text_fragments
- [43]R. Budiu, "Information scent: How users decide where to go next," Nielsen Norman Group, Feb. 2, 2020. Accessed: Nov. 13, 2026. [Online]. Available: https://www.nngroup.com/articles/information-scent/
- [44]A. Mitchell, G. Stocking, and K. E. Matsa, "Long-form reading shows signs of life in our mobile news world," Pew Research Center, May 5, 2016. Accessed: Nov. 13, 2026. [Online]. Available: https://www.pewresearch.org/journalism/2016/05/05/long-form-reading-shows-signs-of-life-in-our-mobile-news-world/
- [45]K. Moran, "Reading content on mobile devices," Nielsen Norman Group, Dec. 11, 2016. Accessed: Nov. 13, 2026. [Online]. Available: https://www.nngroup.com/articles/mobile-content/
- [46]Wikimedia Foundation, "Research:Collapsed vs uncollapsed section view on mobile web," Meta-Wiki. Accessed: Nov. 13, 2026. [Online]. Available: https://meta.wikimedia.org/wiki/Research:Collapsed_vs_uncollapsed_section_view_on_mobile_web
- [47]B. Ciechanowski, "Mechanical watch," ciechanow.ski, May 4, 2022. Accessed: Nov. 13, 2026. [Online]. Available: https://ciechanow.ski/mechanical-watch/
- [48]A. Patel, "2023 Stanford EDUC432," Red Blob Games, 2023. Accessed: Nov. 13, 2026. [Online]. Available: https://www.redblobgames.com/x/2306-educ432/
- [49]J. Evans, "Patterns in confusing explanations," jvns.ca, Aug. 2021. Accessed: Nov. 13, 2026. [Online]. Available: https://jvns.ca/blog/confusing-explanations/
- [50]A. Patel, "Little design things," Red Blob Games, Feb. 21, 2019. Accessed: Nov. 13, 2026. [Online]. Available: https://www.redblobgames.com/making-of/little-things/
- [51]B. Victor, "Explorable explanations," worrydream.com, Mar. 10, 2011. Accessed: Nov. 13, 2026. [Online]. Available: https://worrydream.com/ExplorableExplanations/
- [52]B. Johnson, "SQLite internals: Pages & B-trees," The Fly Blog, Jul. 27, 2022. Accessed: Nov. 13, 2026. [Online]. Available: https://fly.io/blog/sqlite-internals-btree/
- [53]D. Luu, "Some thoughts on writing," danluu.com. Accessed: Nov. 13, 2026. [Online]. Available: https://danluu.com/writing-non-advice/
- [54]M. D. Molina, S. S. Sundar, M. M. U. Rony, N. Hassan, T. Le, and D. Lee, "Does clickbait actually attract more clicks? Three clickbait studies you must read," in Proc. CHI Conf. Human Factors in Computing Systems, May 2021. Accessed: Nov. 13, 2026. [Online]. Available: https://pike.psu.edu/publications/chi21.pdf
- [55]T. Fessenden, "The most hated online advertising techniques," Nielsen Norman Group, Jun. 4, 2017. Accessed: Nov. 13, 2026. [Online]. Available: https://www.nngroup.com/articles/most-hated-advertising-techniques/
- [56]S. Paul, "Scrolljacking 101," Nielsen Norman Group, Aug. 6, 2023. Accessed: Nov. 13, 2026. [Online]. Available: https://www.nngroup.com/articles/scrolljacking-101/
- [57]G. Branwen, "A/B testing long-form readability on Gwern.net," gwern.net. Accessed: Nov. 13, 2026. [Online]. Available: https://gwern.net/ab-test
- [58]A. WennersHerron, "Social media users probably won't read beyond this headline, researchers say," Penn State University, Nov. 19, 2024. Accessed: Nov. 13, 2026. [Online]. Available: https://www.psu.edu/news/research/story/social-media-users-probably-wont-read-beyond-headline-researchers-say
- [59]R. Kohavi, A. Deng, and L. Vermeer, "A/B testing intuition busters: Common misunderstandings in online controlled experiments," in Proc. 28th ACM SIGKDD Conf. Knowledge Discovery and Data Mining, 2022. Accessed: Nov. 13, 2026. [Online]. Available: https://airbnb.tech/wp-content/uploads/sites/19/2025/10/ABTestingIntuitionBusters.pdf
- [60]Matomo, "How do I add a JavaScript heartbeat timer to measure time spent on page, including the last page of their visit?," Matomo FAQ. Accessed: Nov. 13, 2026. [Online]. Available: https://matomo.org/faq/faq_21824/